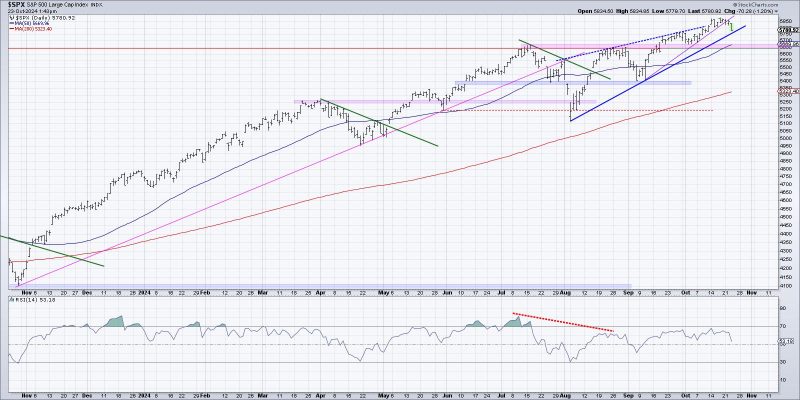
Unlocking the Power of Visualization for Spotting Distribution Phases: Three Easy Techniques
Many traders and investors are constantly on the lookout for signals and indicators that can help them identify potential distribution phases in the market. Understanding when a distribution phase may be starting can be crucial for making informed trading decisions. In this article, we will discuss three effective ways to visualize the start of a potential distribution phase based on various technical indicators and tools.
1. Volume Analysis:
One of the key tools for identifying a potential distribution phase is volume analysis. An increase in trading volume during a period of consolidation or sideways movement could signal that accumulation or distribution is taking place. If the price is moving sideways, but the volume is increasing, it may indicate that smart money is starting to distribute their holdings. Traders can use volume bars on a price chart to visually identify spikes in volume that may coincide with the start of a distribution phase.
2. Moving Averages:
Another effective way to visualize the start of a potential distribution phase is by using moving averages. Moving averages smooth out price data and can help traders identify trends and potential trend reversals. When the price crosses below a key moving average, such as the 50-day or 200-day moving average, it could indicate a shift from accumulation to distribution. Additionally, watching for a bearish crossover between short-term and long-term moving averages can provide further confirmation of a potential distribution phase.
3. Price Patterns:
Price patterns can also be powerful tools for visualizing the start of a potential distribution phase. Patterns such as head and shoulders, double tops, and descending triangles are commonly associated with distribution phases. Traders can analyze these patterns on price charts to identify key support and resistance levels that may signal a shift in market sentiment from accumulation to distribution. Additionally, combining price patterns with volume analysis can provide a more robust signal of a potential distribution phase.
In conclusion, visualizing the start of a potential distribution phase in the market can be a valuable skill for traders and investors. By utilizing tools such as volume analysis, moving averages, and price patterns, market participants can gain insights into shifts in market dynamics and make more informed trading decisions. It is essential to combine these visualization techniques with careful risk management and thorough analysis to maximize the effectiveness of identifying distribution phases and adjusting trading strategies accordingly.
