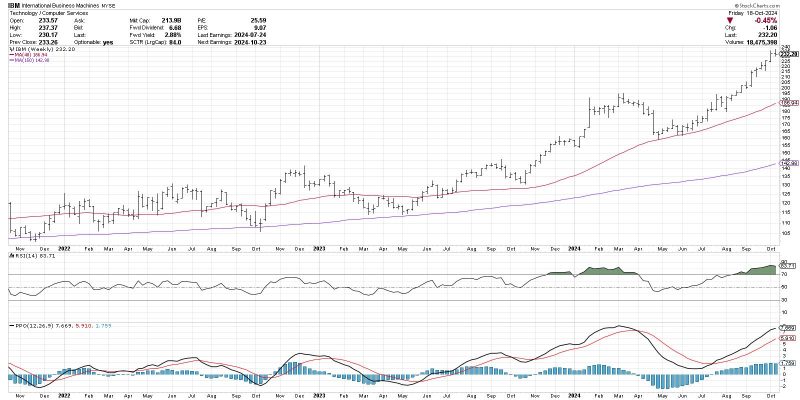
Unveiling the Hidden Power of the MACD Histogram in Predicting Trend Shifts
MACD Histogram: A Powerful Tool for Anticipating Trend Changes
Understanding market trends and effectively predicting changes are essential skills for successful trading and investment. Among the various technical analysis tools available to traders, the Moving Average Convergence Divergence (MACD) histogram stands out as a powerful indicator for gauging potential trend shifts in the financial markets.
The MACD histogram, an extension of the MACD indicator, was developed to provide a visual representation of the difference between the MACD line and the Signal line. This histogram essentially portrays the momentum of a trend, allowing traders to identify shifts in market sentiment and potentially profitable entry and exit points.
One of the key advantages of using the MACD histogram is its ability to reveal divergence between the price action and the indicator itself. Divergence occurs when the price of an asset moves in a different direction from the MACD histogram, signaling a potential reversal or pullback in the trend. By identifying these divergences, traders can anticipate market turns and adjust their trading strategies accordingly.
Another notable feature of the MACD histogram is its sensitivity to changes in market momentum. When the bars of the histogram expand or contract, it indicates acceleration or deceleration in the trend, respectively. Traders can interpret these changes as early warning signs of potential trend reversals or continuations, providing valuable insights into market dynamics.
Furthermore, the MACD histogram is particularly effective when used in conjunction with other technical indicators and chart patterns. By combining the signals generated by the MACD histogram with additional confirmation signals, such as support and resistance levels or trendline breakouts, traders can enhance the reliability of their trading decisions and reduce the risk of false signals.
In conclusion, the MACD histogram is a versatile and powerful tool for anticipating trend changes in the financial markets. Its ability to identify divergence, gauge momentum shifts, and provide timely signals makes it a valuable asset for traders seeking to stay ahead of market trends. By incorporating the MACD histogram into their trading strategies and complementing it with other technical analysis tools, traders can improve their accuracy in predicting market movements and maximize their trading profits.
