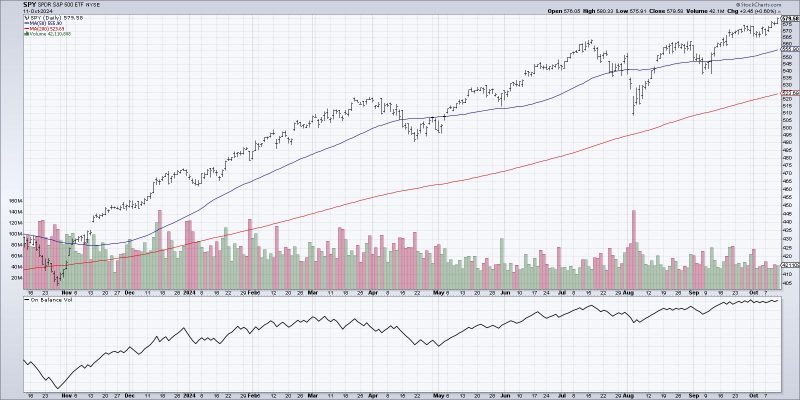
In the fast-paced world of investing and trading, it can be challenging to distinguish noise from valuable information. Investors often rely on various indicators to guide their decisions, but not all indicators are created equal. One volume indicator, in particular, stands out as a crucial tool for understanding market dynamics and making informed trading decisions.
Volume is a key component in technical analysis that provides valuable insights into market activity. It represents the number of shares or contracts traded during a specific time frame, such as a day or an hour. By analyzing volume data, traders can gauge the level of market participation and identify trends and potential reversals.
The one volume indicator that traders should follow is the on-balance volume (OBV). Developed by Joseph Granville in the 1960s, OBV is a simple yet powerful indicator that combines price and volume to show the flow of money into or out of a security. OBV is calculated by adding the volume on days when the price closes higher and subtracting the volume on days when the price closes lower. The resulting OBV line provides a visual representation of the cumulative buying and selling pressure behind a security.
One of the key advantages of OBV is its ability to confirm price trends. When the OBV line moves in the same direction as the price, it suggests that the trend is strong and likely to continue. Conversely, divergence between the OBV line and price can signal a potential trend reversal. By incorporating OBV into their analysis, traders can filter out false signals and focus on high-probability trading opportunities.
In addition to trend confirmation, OBV can also be used to identify potential support and resistance levels. When the OBV line reaches a new high along with the price, it indicates strong buying pressure and suggests that the security is likely to break through resistance levels. Conversely, if the OBV line fails to confirm a new high in price, it may signal a lack of buying interest and potential resistance ahead.
Furthermore, OBV can help traders anticipate upcoming price movements based on divergence signals. For example, if the price of a security is making higher highs while the OBV line is making lower highs, it could indicate underlying weakness and a possible trend reversal. By paying attention to these divergence signals, traders can protect their capital and avoid entering trades against the prevailing market sentiment.
In conclusion, the on-balance volume indicator is a valuable tool for traders seeking to make informed decisions in the market. By analyzing the flow of volume in relation to price movements, traders can gain valuable insights into market dynamics, trend confirmation, and potential reversals. Incorporating OBV into a trading strategy can help traders filter out noise and focus on high-probability opportunities, leading to more consistent and profitable trading outcomes.

