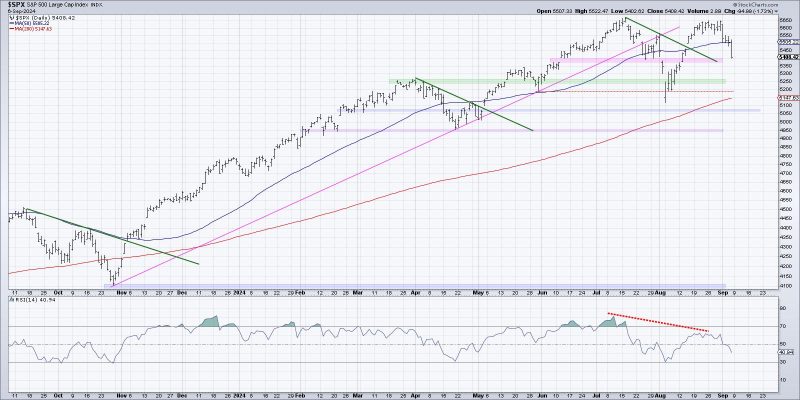
In the realm of stock trading and financial markets, the use of charts and technical analysis plays a crucial role in making informed investment decisions. The article Three Charts Screaming Market Top by GodzillaNewz sheds light on three key charts that are indicating a potential market top. Let’s delve deeper into each of these charts and explore the implications they may have for investors.
The first chart highlighted in the article is the Shiller PE ratio, also known as the cyclically adjusted price-to-earnings ratio. This metric, developed by Nobel laureate Robert Shiller, aims to provide a broader view of market valuation by considering earnings over a 10-year period, adjusted for inflation. When the Shiller PE ratio is elevated, it suggests that stocks may be overvalued, signaling a potential market top. Investors should be wary of investing in equities when this ratio is significantly higher than historical averages, as it may indicate an increased risk of a market downturn.
Moving on to the second chart, the article mentions the Buffet Indicator, named after legendary investor Warren Buffett. This indicator compares the total market capitalization of all US stocks to the country’s GDP, providing insights into market valuation levels. A high Buffet Indicator reading may indicate an overvalued market, potentially signaling a market top. Investors should exercise caution when the Buffet Indicator reaches extreme levels, as it could imply that stocks are expensive relative to the overall economic output, increasing the likelihood of a market correction.
Lastly, the third chart discussed in the article is the Advance-Decline Line, a technical analysis tool that tracks the number of advancing and declining stocks in a given market. A strong advance-decline line typically indicates broad market participation and healthy market conditions. However, a divergence between the advance-decline line and the major stock indices, such as the S&P 500, could signal underlying weakness in the market. If the advance-decline line fails to confirm new highs in the stock market, it may suggest a lack of conviction among investors and a potential market top in the making.
In conclusion, these three charts highlighted in the article provide valuable insights into market dynamics and potential warning signs for investors. By paying attention to key indicators such as the Shiller PE ratio, Buffet Indicator, and Advance-Decline Line, investors can better assess market conditions and make informed decisions to protect their portfolios during periods of market exuberance. In a constantly evolving market environment, a disciplined approach to monitoring these indicators can help investors navigate uncertain times and position themselves for long-term success.

